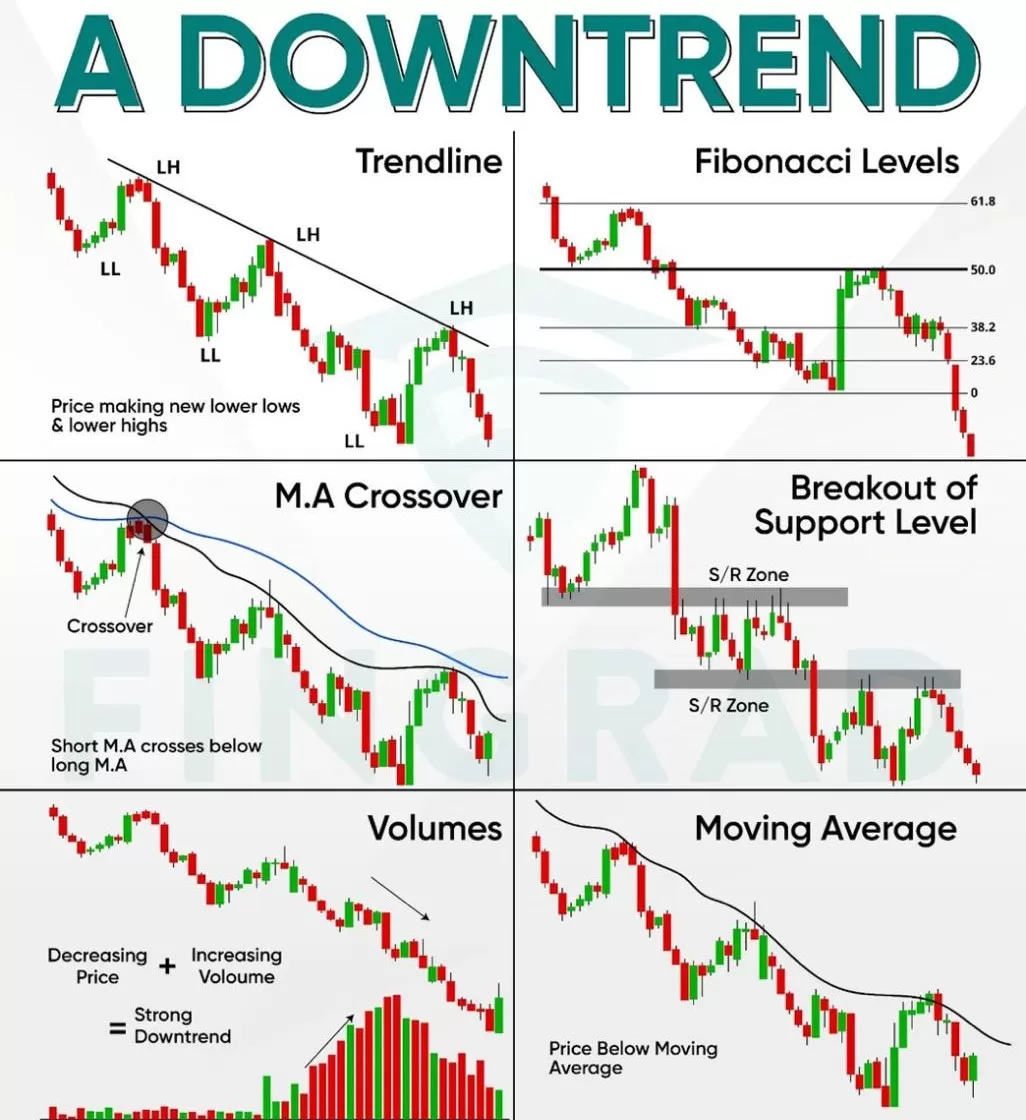
Technical indicators are tools used by traders and analysts to assess the direction of a trend in the financial markets. When looking for a downtrend, several indicators can be helpful. Here are some commonly used technical indicators to identify a downtrend:
Moving Averages:
Simple Moving Average (SMA): A downtrend is often confirmed when the current price is below its SMA. Traders often use longer-term SMAs (e.g., 50-day or 200-day) to identify the overall trend.
Exponential Moving Average (EMA):
Similar to SMA, the EMA gives more weight to recent prices. A crossover of shorter-term EMA below longer-term EMA can indicate a downtrend.
Relative Strength Index (RSI):
RSI measures the magnitude of recent price changes to evaluate overbought or oversold conditions. In a downtrend, RSI often stays below 50, indicating the bearish momentum.
Moving Average Convergence Divergence (MACD):
MACD is calculated by subtracting the 26-period EMA from the 12-period EMA. A negative MACD value suggests a potential downtrend.
Average Directional Index (ADX):
ADX is used to quantify trend strength. A rising ADX value indicates a strengthening downtrend.
Lower Highs and Lower Lows:
Observing a series of lower highs and lower lows on price charts is a visual way to confirm a downtrend.
Price Action Patterns:
Patterns like “lower highs and lower lows,” bearish flags, and descending triangles are often associated with downtrends.
Volume Analysis:
An increase in trading volume during a price decline can confirm the strength of a downtrend.
Bollinger Bands:
Prices often stay below the upper Bollinger Band in a downtrend. A widening of the bands can indicate increased volatility.
Chaikin Money Flow (CMF):
CMF combines price and volume to measure money flow. A negative CMF may suggest selling pressure, confirming a downtrend.
It’s essential to note that no single indicator is foolproof, and traders often use a combination of these tools to make informed decisions. Additionally, market conditions can change, so it’s crucial to consider multiple factors before making trading decisions


