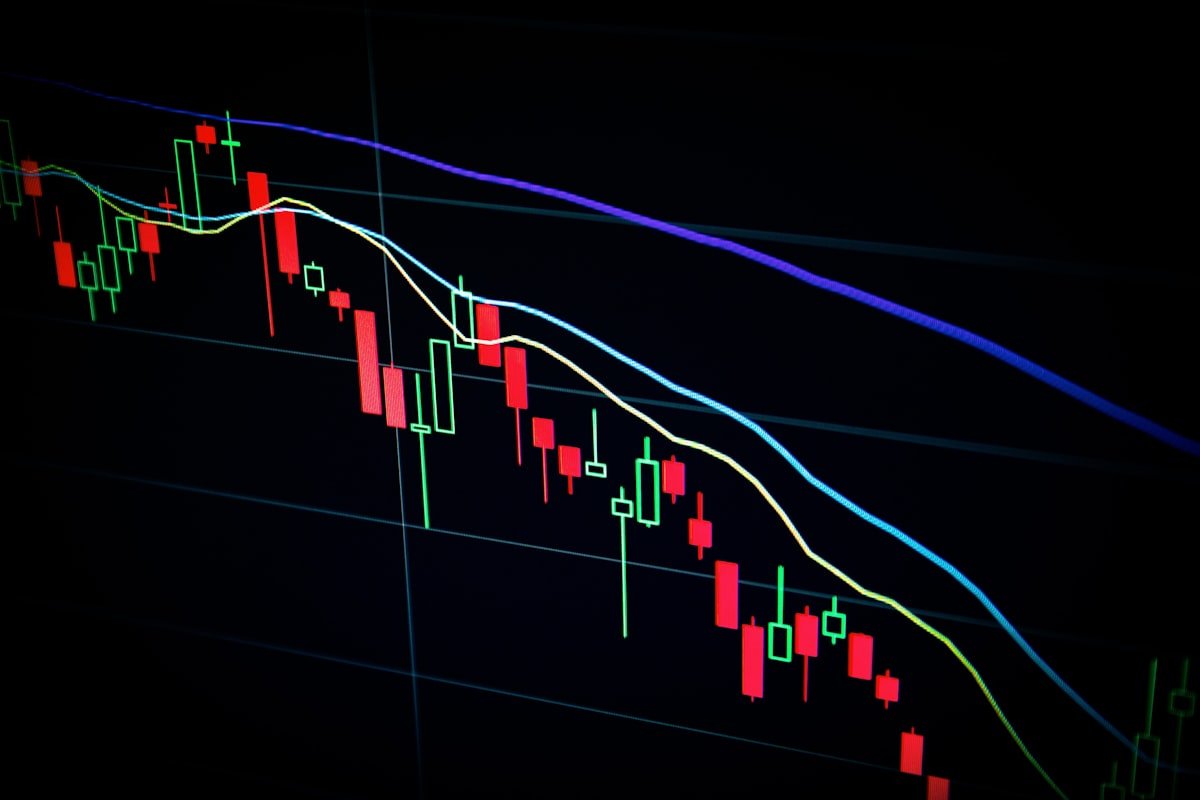
Date: July 16, 2026 | Live BTC/USD Price: ~$65,244.35 (24h change +1.45%, 24h volume ~$29.6B)
Source: CoinMarketCap live ticker (July 16, 2026). Binance’s public ticker API (api.binance.com) returned an empty response on this check, so an alternate live aggregator was used as the fallback source, per protocol — consistent with the approach used in prior editions of this series.
Market Setup
Bitcoin has pushed back up to test the 200-day moving average zone near $65,150–$65,200 — the same structural bull/bear line that capped price on multiple attempts earlier this week (July 13–14). After grinding through a choppy range between roughly $61,300 and $65,200 for the past several sessions, BTC now sits right at that decision point heading into the back half of July. Spot Bitcoin ETFs have logged five straight days of net inflows led by BlackRock’s IBIT, a notable reversal after June’s ETF outflows topped $4.5 billion — the category’s worst month since launch. Momentum indicators have firmed alongside price: daily RSI has climbed into the mid-60s, still short of overbought (70), while the 5-day and 50-day moving averages have both turned higher, flipping the short-term signal mix toward “buy.” The market remains coiled between the June low near $58,000 and a full reclaim of the $65,600–$68,000 zone, with the Fed’s July 28–29 meeting as the next major scheduled catalyst.
- 14-day RSI: ~mid-60s — bullish momentum building, not yet overbought
- 200-day MA: ~$65,150–$65,200 — key structural level price is testing right now
- Moving averages: 5-day (~$64,690) and 50-day (~$63,300) both trending higher, both signaling “buy”
- Resistance: $65,600–$66,250 (immediate), then $68,000, then $70,000–$74,000
- Support: $63,600 (recent range floor), then $61,300 (swing support), then $58,000–$59,000 (June low / major support)
- Momentum: Constructive but unconfirmed — BTC needs a decisive daily close above the 200-day MA to unlock the next leg higher
The setup mirrors the pattern of recent sessions: dip-buyers keep defending the low-$60,000s while sellers repeatedly cap rallies near $65,000–$66,000. A clean break of that ceiling, or a failure back below $63,600, should resolve the next multi-day direction.
Trade Idea
| Parameter | Level |
|---|---|
| Bias | Cautiously bullish — breakout watch above the 200-day MA |
| Entry Zone | $64,800 – $65,600 (on hold/pullback into the reclaimed zone) |
| Stop Loss | $63,600 (below recent range floor / 200-day MA breakdown) |
| Target 1 | $66,250 — R:R ≈ 1.1:1 |
| Target 2 | $68,000 — R:R ≈ 1.9:1 |
| Target 3 | $70,000–$74,000 — R:R ≈ 3.6:1+ |
Alternate setup: A rejection at the 200-day MA, or a hawkish surprise ahead of the July 28–29 FOMC meeting, could send BTC back toward $61,300, with $58,000–$59,000 (the June low) as an extended downside target if that support fails on volume.
Invalidation: A daily close below $63,600 reopens the path toward $61,300 and $58,000–$59,000. A strong daily close above $65,200 breaks the multi-session ceiling and supports a push toward $66,250–$68,000.
Key Factors
Bullish:
- BTC is testing a decisive break above the 200-day MA (~$65,150–$65,200) that has repeatedly rejected price over the past week
- Spot Bitcoin ETFs have logged five consecutive days of net inflows led by BlackRock’s IBIT, suggesting institutional demand is returning after June’s $4.5B outflow month
- Daily RSI has climbed into the mid-60s with the 5-day and 50-day moving averages both trending higher, flipping short-term signals toward “buy”
- Cooling inflation data has reduced market-implied odds of a Fed rate hike, with prediction markets now pricing roughly 95% odds the Fed holds steady on July 28–29
Bearish:
- BTC has failed to close decisively above the 200-day MA on multiple recent attempts, leaving the broader trend unconfirmed
- June’s $4.5B spot ETF outflow wave is a reminder that institutional sentiment can reverse quickly if macro conditions shift
- The Fed’s July 28–29 meeting remains a binary risk event; any hawkish surprise from Fed Chair Kevin Warsh could reignite the risk-off pressure that drove BTC to a 21-month low near $58,000 in late June
- Bitcoin continues to trade as a high-beta risk asset, leaving it exposed to broader equity and oil-driven macro volatility tied to ongoing Middle East tensions
Macro Watch
- FOMC meeting, July 28–29, 2026 — the next major scheduled catalyst; markets currently price a hold as the dominant outcome
- Spot Bitcoin ETF daily flow data for confirmation that the current five-day inflow streak is sustaining
- Fed Chair Kevin Warsh’s public commentary and any congressional testimony ahead of the meeting
- Oil price trajectory tied to Middle East/Strait of Hormuz tensions and its read-through to inflation expectations
Sources
- CoinMarketCap — Bitcoin Price Live Data
- Investing.com — Bitcoin (BTC) Technical Analysis
- CoinDesk — Bitcoin Rally Cools as Investors Digest Inflation Data, Oil Clouds Outlook
- Forbes — Bitcoin Now Braced For A Critical Fed July Price “Pivot Point”
- The Motley Fool — Crypto Market Today: Fed Comments Lift Bitcoin Above $60,000
- Blockchain.News — Polymarket Odds: Fed July Hold Jumps to 95% After Bitcoin Breaks $65K
- Binance — BTCUSDT Ticker API (attempted, empty response)
Disclaimer: This content is for informational and educational purposes only and does not constitute financial or investment advice. Cryptocurrency trading carries a high level of risk and may not be suitable for all investors. Always do your own research and consult a licensed financial advisor before making any trading or investment decisions.