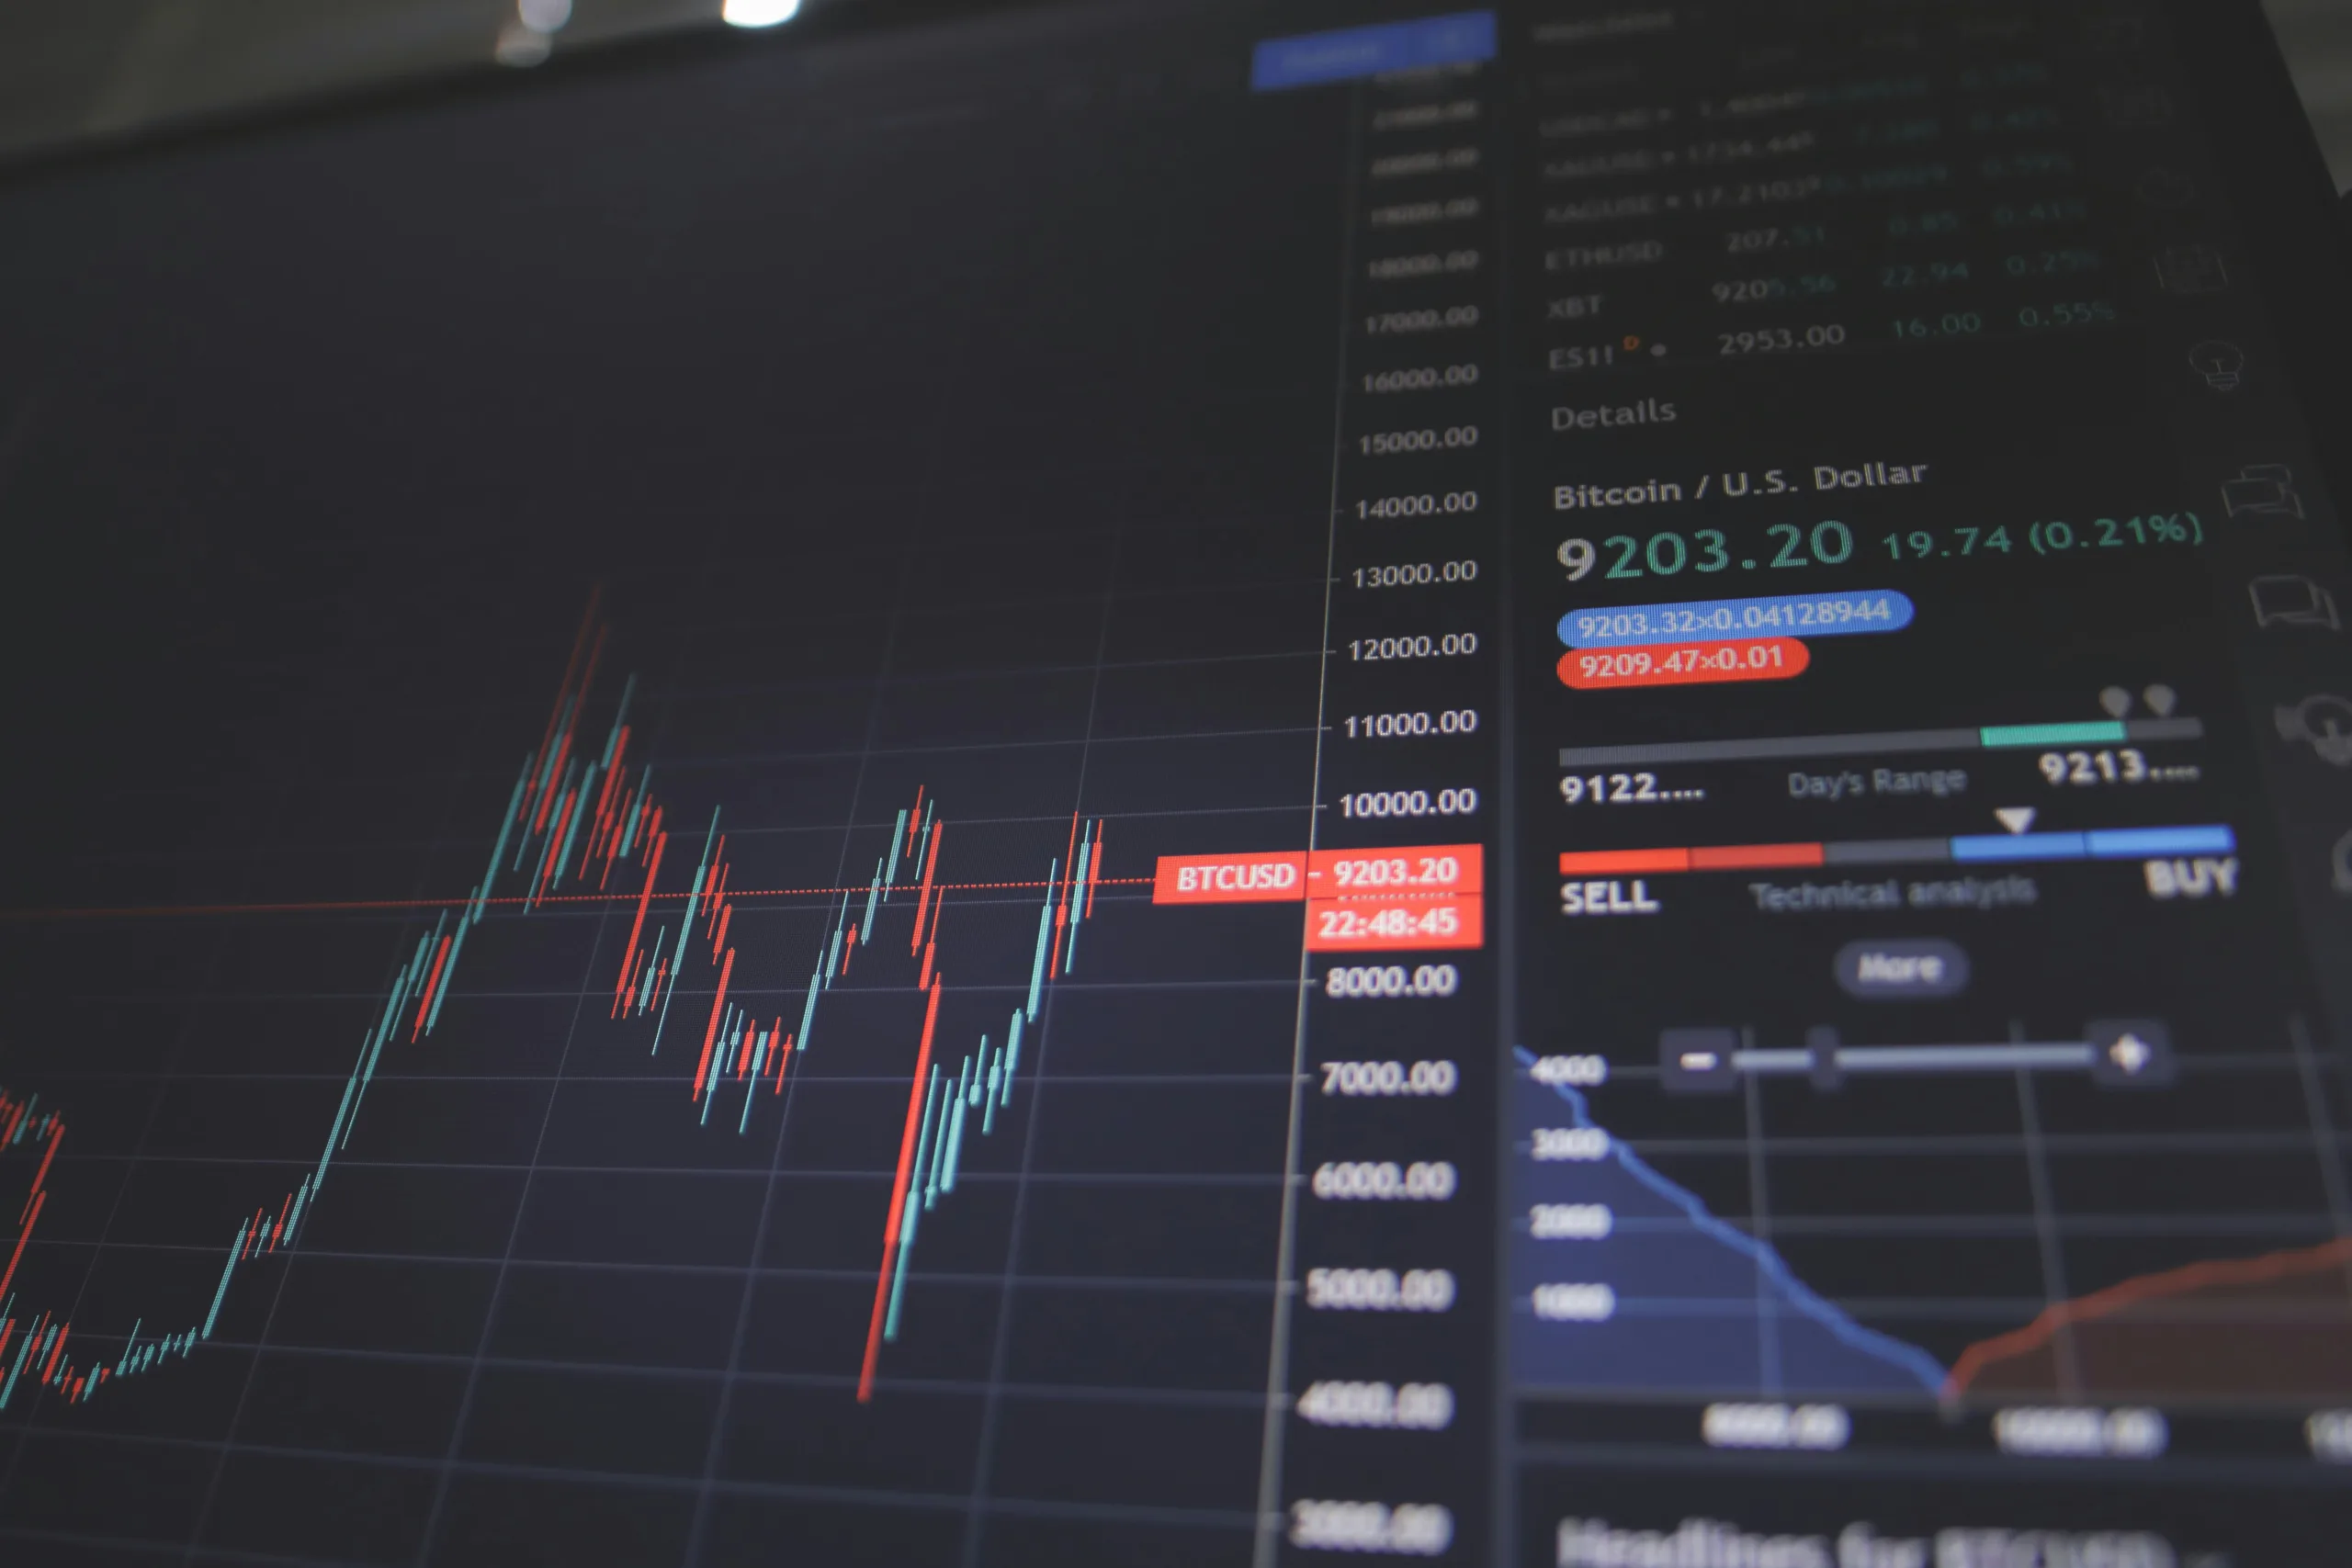
On the monthly chart, NYMEX Natural Gas is currently trading near multiyear support levels. This indicates a potential reversal in the price trend.
Furthermore, on the daily chart, a bullish reversal pattern has emerged in the form of a strong bullish engulfing candlestick. This candlestick has engulfed the previous three candles, suggesting a shift in market sentiment from bearish to bullish.
Confirmation of this bullish reversal might be imminent as the price is currently trading comfortably above the bullish engulfing candle. This indicates that buyers are in control and are likely to push the price higher in the near term.
In terms of price targets, the initial upside target for the bulls could be around $2.16 (MCX 180). This level could serve as a significant resistance point where sellers might enter the market.
On the other hand, if the price fails to sustain its bullish momentum, the pattern low of $1.522 (MCX 126) would act as a support level. If the price falls below this level, it would invalidate the bullish view and suggest a continuation of the downtrend.
In conclusion, the NYMEX Natural Gas price is showing signs of a bullish reversal, with the potential for further upside towards the $2.16 (MCX 180) level. Traders should closely monitor the price action and consider the pattern low of $1.522 (MCX 126) as a key support level.


