


Global Markets Today: GIFT Nifty and Dow Futures Point Toward a Cautious Start
Wednesday, April 29, 2026 — Investors are waking up to a mixed global landscape this morning as the domestic market


Top Trending Coins
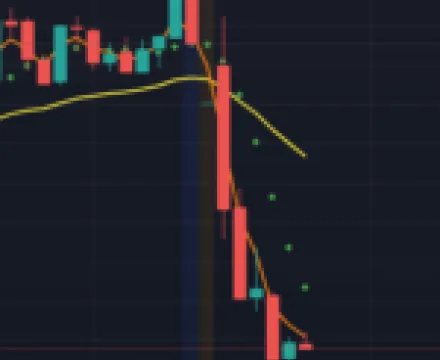
60 / 100 Powered by Rank Math SEO SEO Score Technical Trade Ideas: Significant Volume surges and critical price action

Crypto Macro & Sentiment
66 / 100 Powered by Rank Math SEO SEO Score Macro & Sentiment Context Risk-Off Environment: The geopolitical news surrounding


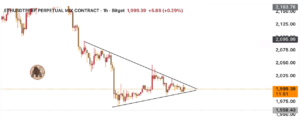
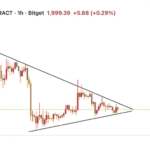
BTC/USDT 1H Analysis
49 / 100 Powered by Rank Math SEO SEO Score Technical Analysis Current Price: ~$72,984 | Sell: $72,950 | Buy:
Market Update
Market Update: Stocks in Focus, Opening Bell, and Global Cues Indian markets opened the session on a mixed but active


Please follow and like us:


