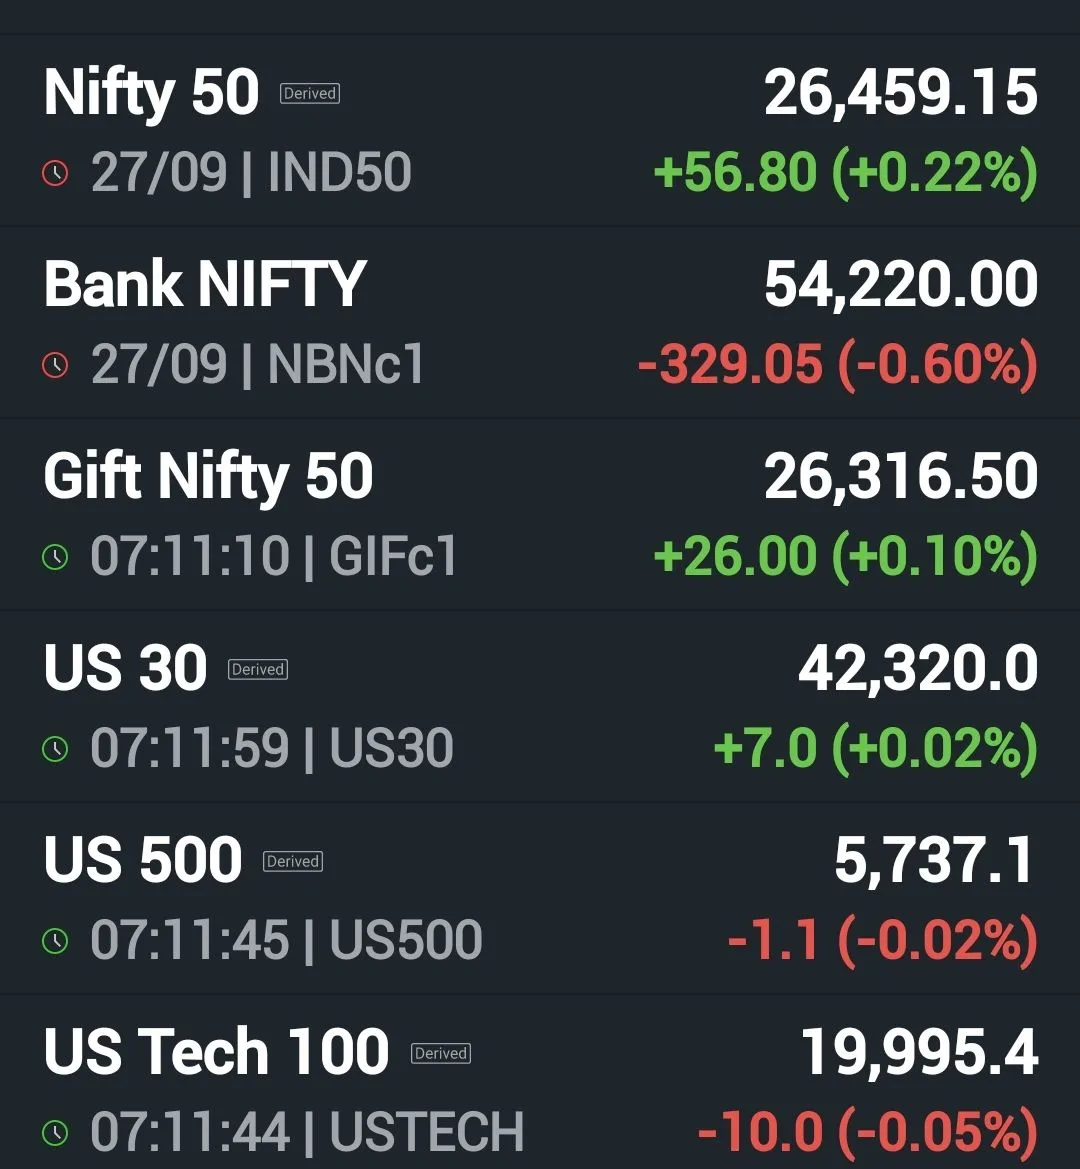
The Indian stock market today kicked off the week deep in the red, with the Nifty 50 sliding below the critical 23,800 support on Monday, September 7, 2026. A sharp IT selloff triggered by surging crude oil prices — driven by fresh US-Iran conflict escalation — weighed on benchmarks, even as India’s macro fundamentals (Q1 FY27 GDP at 7.8%) continued to provide a structural floor. This is your complete Indian stock market today wrap from NSE and BSE.
🔴 Closing Bell — NSE & BSE Final Numbers
| Index | Close | Change | % Change |
|---|---|---|---|
| Nifty 50 | 23,779.15 | ▼ 120.00 | -0.50% |
| Sensex | 76,132.81 | ▼ 380.00 | -0.50% |
| Bank Nifty | 57,369.65 | ▼ 10.95 | -0.02% |
| India VIX | 11.34 | ▲ 0.66 | +6.17% |
Broader market breadth was mixed — 1,603 stocks advanced against 1,535 decliners on NSE, but the damage was concentrated in large-cap IT names that carry heavy index weight.
⚡ Three Forces That Drove the Selloff
1. Crude Oil Shock — US-Iran Tensions Reignite
Fresh military exchanges in the US-Iran conflict sent crude oil surging, rekindling fears of imported inflation and margin compression across oil-sensitive sectors. Elevated US Treasury yields — sticky from a resilient American jobs market — added an additional headwind by making emerging-market equities less attractive to global funds.
2. IT Sector Meltdown
The Nifty IT index fell approximately 2.3%, making it the single biggest sectoral drag on today’s session. Infosys led losses at -3.8%, followed by TCS, HCL Technologies, and Tech Mahindra — all of which ended meaningfully lower. Concerns about discretionary IT spending cuts by US corporates, tied to rising borrowing costs, drove the selloff. Hindustan Unilever also weighed on the FMCG space.
3. FII Selling Overhang
Foreign Institutional Investors were net sellers of ₹3,111.90 Cr in the cash segment on September 4 (last Friday). Provisional data for September 7 suggests continued net selling as rising US yields drew capital back toward dollar-denominated assets. The FII selling overhang suppressed any meaningful recovery attempt through the afternoon session.
💥 FII vs DII — The Flow Picture
| Category | Activity (Sep 4) | Net Flow |
|---|---|---|
| FII / FPI | Net Sellers | -₹3,111.90 Cr |
| DII | Net Buyers | +₹8,930.10 Cr |
DIIs — primarily domestic mutual funds and insurance companies — continued to absorb FII supply aggressively, providing crucial support that prevented a sharper index fall. September 7 final FII/DII data is expected to be published by NSE by 10:00 PM IST; check NSE India’s website for the update. The DII cushion remains the key reason broader market breadth stayed relatively supportive even as the headline index broke 23,800.
📦 Heaviest Hitters — Largecap Movers
| Stock | Move | Why |
|---|---|---|
| Infosys | -3.8% | Worst IT performer; concerns on US tech spend cuts |
| TCS | -1.8% | Sympathy selling in IT; high US revenue exposure |
| HCL Technologies | -1.6% | Dollar yield headwinds; IT sector rotation out |
| Tech Mahindra | -1.4% | Broad IT selloff; weak global sentiment |
| Hindustan Unilever | -0.9% | FMCG margin pressure on crude-linked input costs |
| BEL | +0.4% | Defence capex story; geopolitical demand tailwind |
| Eternal (Zomato) | +0.6% | Consumer discretionary rerating; quick commerce growth |
| Bajaj Finance | +0.5% | NBFC rotation; rate-cut anticipation |
| Bharti Airtel | +0.4% | Telecom ARPU upgrade cycle intact |
| Adani Ports | +0.3% | Infrastructure play; port volumes steady |
📌 Technical Levels — The Map for Tuesday, September 8
Nifty 50 Technical Setup
Close: 23,779.15 | Trend: Short-term bearish; short-medium-term MAs sloping downward
- Immediate Support: 23,800 (now breached — watch for retest from below)
- Next Support: 23,500 | Deeper Support: 23,140 (critical swing low)
- Immediate Resistance: 24,000 (psychological + supply zone)
- Next Resistance: 24,200 | Breakout Target: 24,400
- Bias: Bearish below 24,000 | Neutral-bullish only on close above 24,200
Bank Nifty Technical Setup
Close: 57,369.65 | RSI: ~50 (neutral) | Pattern: 2nd consecutive small bearish candle; consolidating near 50-day EMA
- Support Zone 1: 57,300 – 57,000
- Support Zone 2: 56,500 – 56,200 (52-week EMA confluence; critical floor)
- Resistance 1: 57,600 – 57,800
- Resistance 2: 58,000 (psychological; breakout trigger)
- Bias: Consolidation; directional trigger needed. Break below 57,000 opens 56,200.
📅 The Week Ahead — Calendar to Trade Around
| Date | Event | Relevance |
|---|---|---|
| Sep 8 (Tue) | US JOLTS Job Openings | Labour market health → Fed rate path |
| Sep 9 (Wed) | India CPI Inflation watch | Inflation trajectory for RBI |
| Sep 10 (Thu) | US CPI Inflation Data | Crucial for Fed rate cuts and EM flows |
| Sep 11 (Fri) | India WPI / Industrial Production | Demand-side health check |
| Ongoing | US-Iran conflict developments | Crude oil risk; inflation + CAD impact |
| Ongoing | Q2 FY27 Pre-earnings season | Management commentary on IT, BFSI |
Key macro backdrop: India’s Q1 FY27 GDP growth came in at a robust 7.8%, while GST collections remained healthy — providing a strong structural floor even as global headwinds persist. Headline inflation stood at 4.45% in July 2026, still within the RBI’s comfort zone of 2–6%.
🎯 Trade Ideas — 4 Setups for Tuesday
1. Nifty Index — Short Bias
Setup: Nifty broke 23,800 support on volume; short-term trend is down. Look to sell rallies.
Entry: Sell on bounce to 23,850–23,900 zone
Targets: 23,650 / 23,500 / 23,140
Stop Loss: Close above 24,000
Invalidation: Sustained move above 24,000 with volume
2. Bank Nifty — Range Trade
Setup: Bank Nifty is stuck in a 57,000–57,800 range; RSI at 50 signals indecision.
Long: Near 57,000–57,100 support | Short: Near 57,700–57,800 resistance
Targets: 200–400 points either side
Stop Loss: Break below 56,800 (long), break above 58,050 (short)
Invalidation: Decisive breakout/breakdown beyond range
3. Weekly Options Play — Nifty Put on Elevated VIX
Setup: India VIX jumped 6.17% to 11.34 — elevated premium environment favours option buying briefly.
Trade: Buy Nifty 23,700 PE (Sep 11 expiry) near 50–70 points
Target: 100–130 points if Nifty tests 23,500
Stop Loss: Option value halving (below 25 points)
Invalidation: VIX falls below 10.5 OR Nifty reclaims 24,000
4. Stock-Specific — Wait for IT Stabilisation
TCS: Watch for bounce near its 200-DMA; accumulate in tranches if it holds support. Quality compounder for patient investors.
Infosys: Oversold near-term; wait for at least one green candle before re-entry. Risk-reward improves near ₹1,480–₹1,500.
BEL: Outperformed today; breakout candidate if it holds gains above today’s close with defence ordering cycle intact.
⚠️ Educational content only. Not investment advice. Consult a SEBI-registered advisor before trading.
🔥 Sentiment Read
India VIX closed at 11.34, up 6.17% — a notable spike that signals hedging activity has picked up, but the index is still well below the 15–20 “fear” zone. This suggests elevated caution rather than panic. Derivatives data shows Call writing at 24,000 was heavy, confirming it as the key near-term ceiling; Put writers were active at 23,500, which may act as a strong floor.
On social platforms and trader communities, the mood heading into Tuesday is defensive: IT bears are positioning for further weakness, while contrarians are watching BFSI names (Bajaj Finance, HDFC Bank) for a rotation trade. Crude oil sensitivity was the dominant conversation — if Brent stabilises below $85, expect an IT bounce. FII selling remains the primary concern; until that reverses, sharp rallies will likely face distribution at each resistance.
👀 Tomorrow’s Watch List
- 🛢️ Crude oil prices — Brent’s reaction overnight will set Tuesday’s opening mood
- 🌐 US-Iran news flow — any ceasefire signals could trigger sharp risk-on reversal in IT
- 📊 FII cash segment data (Sep 7) — NSE end-of-day release; key for confirming or negating the selling trend
- 💻 Nifty IT stabilisation — if Infosys reclaims ₹1,500+ it could lift broader IT sentiment
- 🏦 Bank Nifty 57,800 breakout — BFSI is the next rotation target; watch for Bajaj Finance and HDFC Bank leadership
📖 Glossary — Monday Edition
Nifty 50: India’s benchmark stock index comprising the 50 largest and most liquid companies listed on the National Stock Exchange (NSE). It is market-cap weighted and tracks the overall health of Indian large-cap equities.
Sensex: The BSE Sensex (S&P BSE Sensitive Index) tracks 30 of the largest and most financially sound companies listed on the Bombay Stock Exchange. Often used alongside Nifty as an Indian market barometer.
FII / FPI: Foreign Institutional Investors / Foreign Portfolio Investors — overseas funds, hedge funds, and institutions that invest in Indian equities and bonds. Their net buying/selling is a major market sentiment driver.
DII: Domestic Institutional Investors — Indian mutual funds, insurance companies, pension funds, and banks. They typically buy on dips when FIIs sell, providing market stability.
India VIX: The Volatility Index for India — computed by NSE using Nifty options prices. Higher VIX = more fear and uncertainty in the market. Below 12 is calm; 15–20 is elevated; above 20 signals high volatility.
Support / Resistance: Key price levels where historical buying (support) or selling (resistance) has been concentrated. A break below support or above resistance is a significant technical signal.
RSI (Relative Strength Index): A momentum oscillator (0–100) measuring speed and change of price movements. Above 70 = overbought; below 30 = oversold; ~50 = neutral momentum.
EMA (Exponential Moving Average): A type of moving average that gives more weight to recent prices. The 50-EMA and 200-EMA are widely used trend-following indicators.
Sources: NSE India | Moneycontrol | Business Today | India TV News | 5paisa | Goodreturns | BusinessToday VIX data
⚠️ Disclaimer: This article is for educational and informational purposes only. It does not constitute investment advice. Past market performance is not indicative of future results. Please consult a SEBI-registered investment advisor before making any trading or investment decisions.