Mastering Entry Confirmation with Candlestick Patterns A Technical Overview
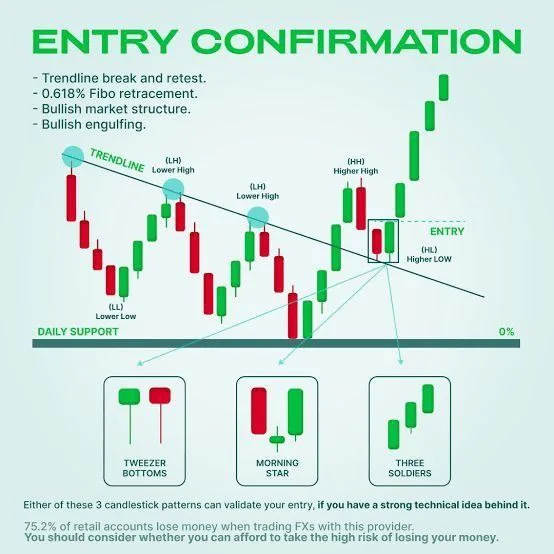
For those trading in volatile markets, one of the most crucial aspects of technical analysis is recognizing the right point of entry. It ensures you’re catching the trend at the most opportune moment, maximizing gains while minimizing risks. In this blog, we break down some essential elements from the chart, focusing on how technical traders use key patterns and concepts like trendline breaks, Fibonacci retracements, and candlestick formations to confirm an entry
Key Components of Entry Confirmation
1. **Trendline Break and Retest**
– A trendline is drawn by connecting two or more swing highs or lows in a downtrend or uptrend, respectively. When price breaks this trendline, it signals a potential shift in market direction.
– After the break, the price usually retests the trendline, allowing traders to confirm the break wasn’t a false move. Once it’s retested successfully, it’s a prime opportunity for entering a trade.
2. 0.618% Fibonacci Retracement
– The Fibonacci retracement tool is widely used in technical analysis. The 61.8% retracement level (derived from the Fibonacci sequence) is a golden ratio where price often reverses during corrective phases. Traders look for price action around this level to gauge whether it will resume in the original direction.
– When paired with other technical signals, like the trendline retest, it strengthens the case for a trade entry.
3. Bullish Market Structure
– Market structure refers to the pattern of highs and lows on the price chart. A bullish market structure is characterized by higher highs (HH) and higher lows (HL). This shows that buyers are in control, pushing the price up over time.
– Traders look for signs of this bullish structure developing to confirm that the market is favorable for long positions.
4. Bullish Engulfing Pattern
– A bullish engulfing pattern is a two-candlestick formation where the second green candlestick completely engulfs the previous red candlestick. This signifies strong buyer momentum and is often used as a signal to enter long trades.
Key Candlestick Patterns for Entry Validation
Candlestick patterns play a pivotal role in confirming the right entry point. The chart provided highlights three such patterns that validate an entry:
1. Tweezer Bottoms
– This pattern consists of two or more candles with similar lows, signaling a potential bottom in price and a possible reversal. It’s typically seen after a downtrend, where bulls step in to absorb selling pressure.
2. Morning Star
– The Morning Star is a three-candlestick pattern: the first candle is bearish, the second is a small-bodied candle (either bullish or bearish), and the third is a strong bullish candle. This pattern signifies a strong reversal in momentum from sellers to buyers.
3. Three Soldiers
– This is a strong bullish reversal pattern consisting of three consecutive long-bodied green candles. Each candle closes higher than the previous, indicating sustained buying interest and signaling a bullish trend continuation.
Putting it All Together
To confirm an entry into a trade, technical traders rely on the confluence of several factors:
– Trendline break and retest** ensures that a prior trend has concluded.
– Fibonacci retracement** helps determine key support or resistance levels where price is likely to reverse.
– Bullish market structure** confirms the underlying direction of the market.
– Candlestick patterns like **tweezer bottoms, morning star, and three soldiers further validate that market sentiment has shifted in favor of buyers.
Entry confirmation is all about stacking odds in your favor by using multiple indicators and patterns. In this example, the trendline break, Fibonacci retracement, and bullish market structure provide a foundation, while the candlestick patterns offer the final validation. Traders should remember that technical analysis is not foolproof, and the risk should always be managed appropriately.
By mastering these elements, you can improve the precision of your trade entries, leading to higher potential profitability.
